USGS 03034000 Mahoning Creek at Punxsutawney, PA

PROVISIONAL DATA SUBJECT TO REVISION

Click to hidestation-specific text


Station gage imageSTATION.--03034000 MAHONING CREEK AT PUNXSUTAWNEY,
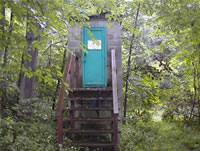
 PA
LOCATION.--Lat 40`56'21", long 79`00'31", Jefferson County, Hydrologic Unit 05010006, on right bank 75 ft downstream from Williams Run, 1.9 mi downstream from Sawmill Run, and 2 mi west of Punxsutawney.
DRAINAGE AREA.--158 square miles.
PERIOD OF RECORD.--October 1938 to current year.
GAGE.--Water-stage recorder. Datum of gage is 1,205.5 ft above North American Vertical Datum of 1988. Prior to Oct. 1, 1946, at site 2.9 mi upstream at datum 13.30 ft higher. Prior to November 2, 2023, the datum of gage was reported as 1206.14 ft above National Geodetic Vertical Datum of 1929. Satellite telemetry at station.
COOPERATION.--Station established and maintained by the U.S. Geological Survey. Funding for the operation of this station is provided by the U.S. Army Corps of Engineers, Pittsburgh District, the Pennsylvania Department of Environmental Protection and the U.S. Geological Survey.
REMARKS.--Diurnal fluctuations at low flow by mine pumpage into stream above station.
This station managed by the PAWSC Pittsburgh Field Office.

Available Parameters Available Period
  
2010-12-17  2024-04-18
1991-10-01  2024-04-18
2007-10-01  2024-04-18
2010-12-17  2024-04-18
2011-06-03  2024-04-18
2011-06-03  2024-04-18
2021-10-01  2024-04-18


 (7)
 

  -- or --


Summary of all available data for this site
Instantaneous-data availability statement


Temperature, water, degrees Celsius

Most recent instantaneous value: 12.3 04-18-2024   17:45 EDT
Graph of

Add up to 2 more sites and replot for "Temperature, water, degrees Celsius"

?


Create presentation-quality / stand-alone graph.   Subscribe to WaterAlert      

See this graph on the Monitoring Location Pages


Discharge, cubic feet per second

Most recent instantaneous value: 1040 04-18-2024   17:45 EDT
Graph of

Add up to 2 more sites and replot for "Discharge, cubic feet per second"

?


Create presentation-quality / stand-alone graph.   Subscribe to WaterAlert      

See this graph on the Monitoring Location Pages


Daily discharge, cubic feet per second -- statistics for Apr 18 based on 85 water years of record more
Min
(1946)
25th
percen-
tile
Median Mean 75th
percen-
tile
Most Recent
Instantaneous
Value Apr 18
Max
(1972)
98.0 205 308 403 550 1040 1250


Gage height, feet

Most recent instantaneous value: 3.76 04-18-2024   17:45 EDT
Graph of

Add up to 2 more sites and replot for "Gage height, feet"

?


Create presentation-quality / stand-alone graph.   Subscribe to WaterAlert      

See this graph on the Monitoring Location Pages